 XL-Excellence® - Examples - Formula consistency
Formula inconsistency can be a major source of spreadsheet weakness. The following example shows how the XL-Excellence® Add-In can detect and report on spreadsheet inconsistencies.
Two ways are shown below of calculating a running total ‐ a “bad” way (rows 2 to 5) and a “good” way (rows 7 to 10).
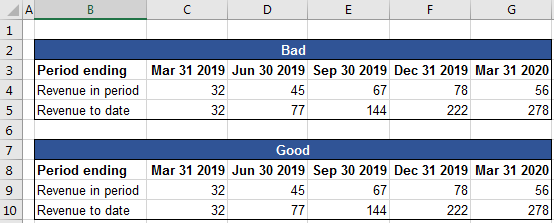
Both methods give the same answer (rows 5 and 10) but only the “good” method uses consistent formulas ‐ as shown by the following report.

The heatmap above has been generated to report on formula consistency. Cells with the same colours contain the same formulas.
The report leaves the original spreadsheet unchanged - it is composed on a new spreadsheet. To maximise speed and minimise memory required the report is a "lightweight" copy of the original: Formulae are not copied - only values and formatting (but not conditional formatting).
Note also that you can "hyperlink" between the original spreadsheet and the report in order to examine formulae in the original spreadsheet.
The colours change above on row 5 in the “bad” method ‐ but the colours are consistent on row 10 in the “good” method. Why is that?
We can answer that by putting the original spreadsheet into “Formula View” mode. Pressing the CTRL + ` keys does that. Now the spreadsheet shows the underlying formulas.

We can see formulas are inconsistent in the “bad” method: The formula in cell C5 picks up the first revenue. Following formulas are different: They add the current period's revenue to the prior period's running total.
How does the “good” method work?

The “good” method uses a consistent formula: The cumulative revenue is the sum of revenues from the “anchor” cell ($C$9) to the current period's cell (xx$9).
If you wish to experiment with the examples discussed above you can download the examples by choosing from the Links section.
 Next >>